
How to read your results.
Your InBody 970 report gives you more than a weight reading. Here is what every metric in your body composition report means, in plain language.
Bars read against the 100% average for your height, the way your InBody report does.
Real values from a single BodyIntel scan, shared with permission. Not a medical assessment.
Read your report in four steps.
Start with muscle and fat
Find your skeletal muscle mass and body fat percentage. These two numbers are the headline of your report and the clearest markers of training progress.
Check your segmental balance
Look at the arm, leg and trunk breakdown. Balanced lean mass across segments is a useful training signal; big differences are worth showing your trainer.
Note your Phase Angle
Record your Phase Angle alongside the benchmark range for your age and gender group shown in your report. It is a body composition benchmark to track over time, not a clinical result.
Set your next comparison
Circle the two or three numbers you want to move, and book your next scan four to eight weeks out. The comparison between scans tells you far more than any single scan can.
What your report actually looks like.
Your scan produces the full InBody 970 result set, the same family of reports used in research facilities and elite performance environments, delivered straight to the InBody app. Your operator walks you through it on screen before you leave.
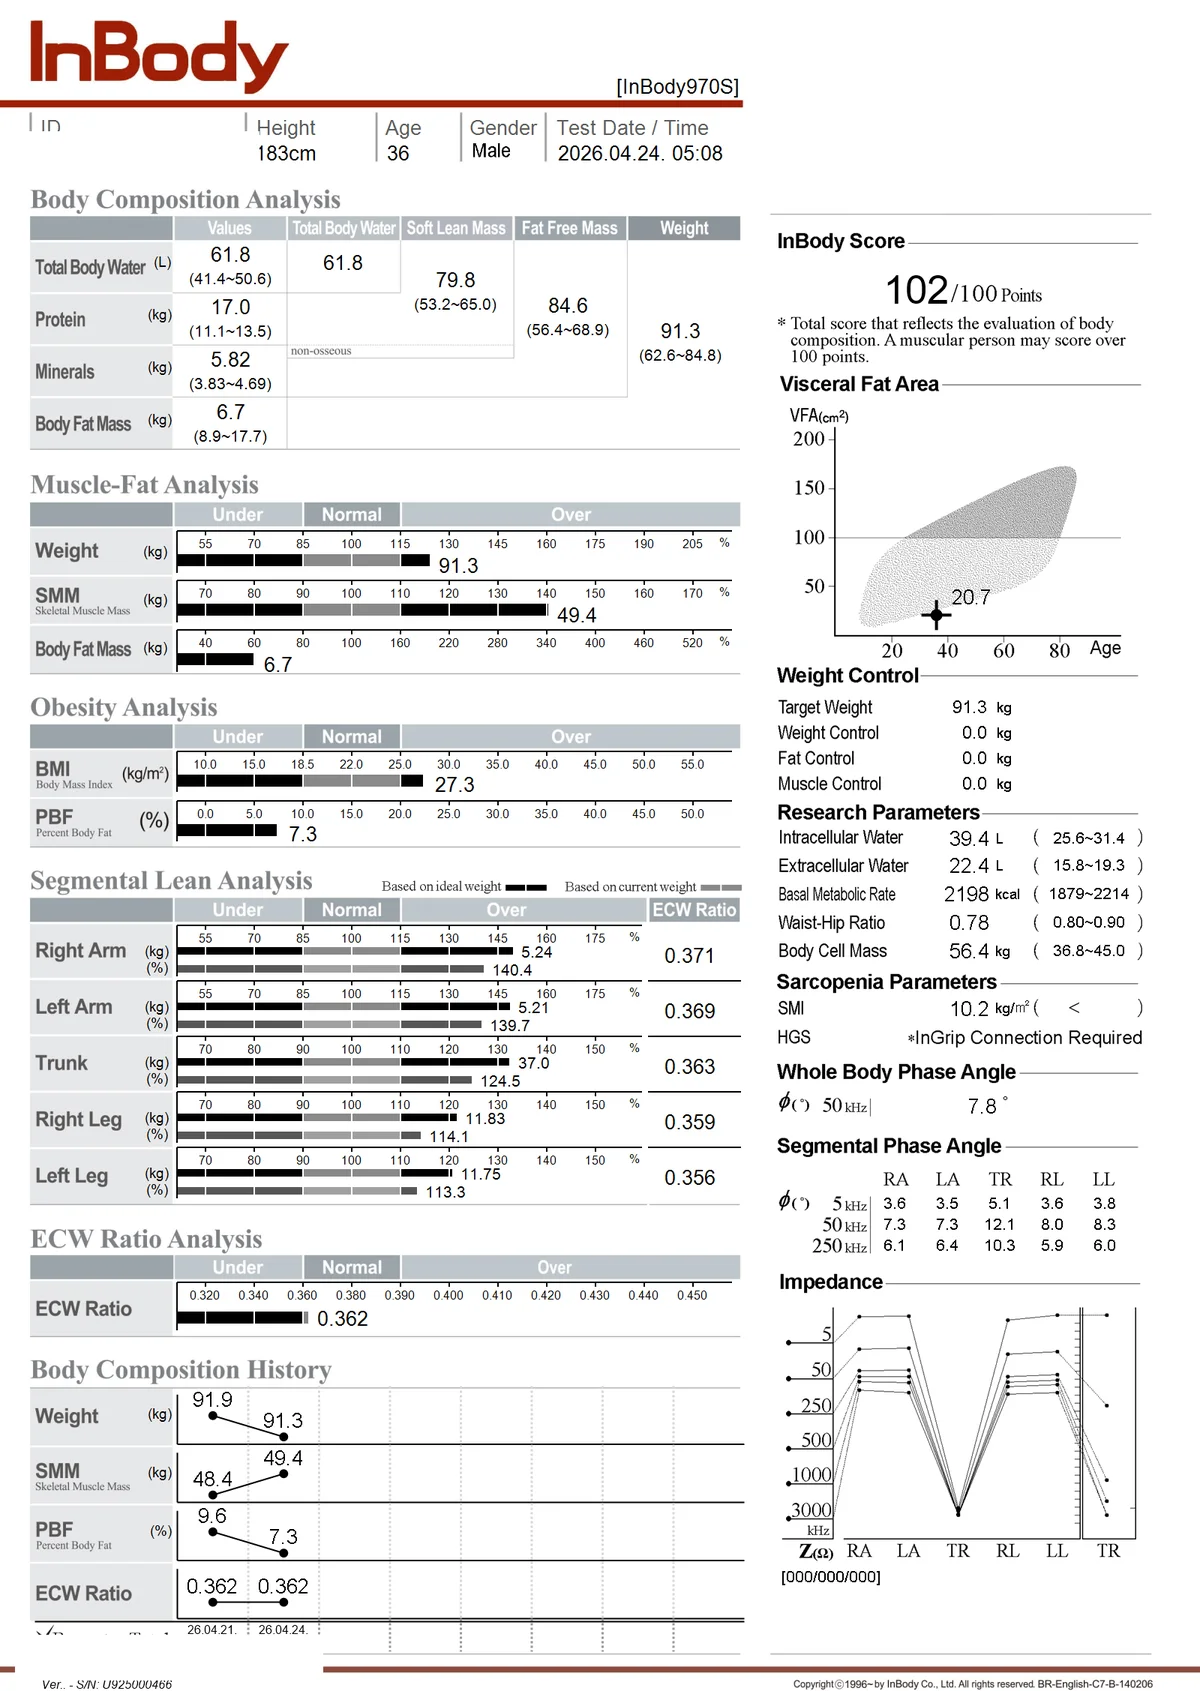
A real InBody 970S report from a BodyIntel scan, shared with permission. Personal details redacted.
Every scan syncs to the InBody app.
Review your dashboard, compare your segments, and watch your history build from scan to scan. The app is free and links to your results automatically.
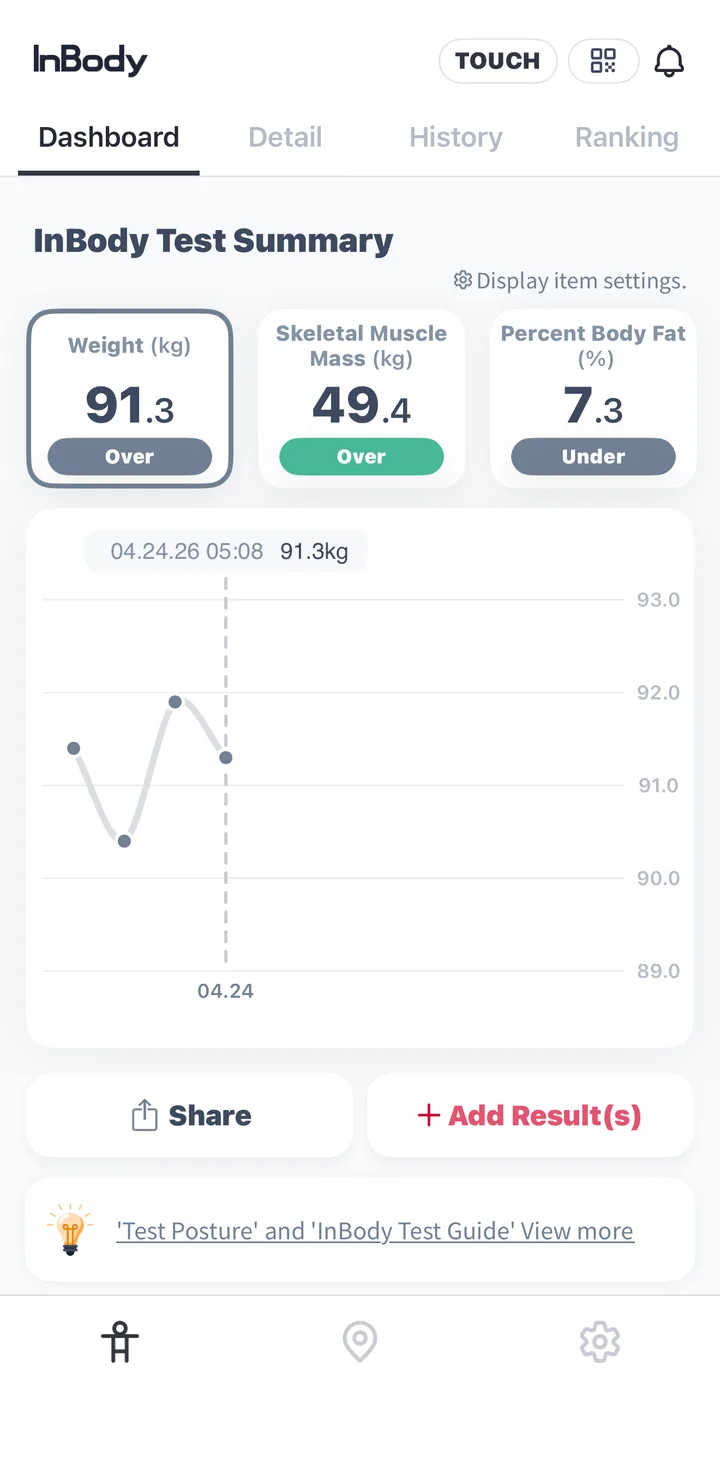
Your dashboard
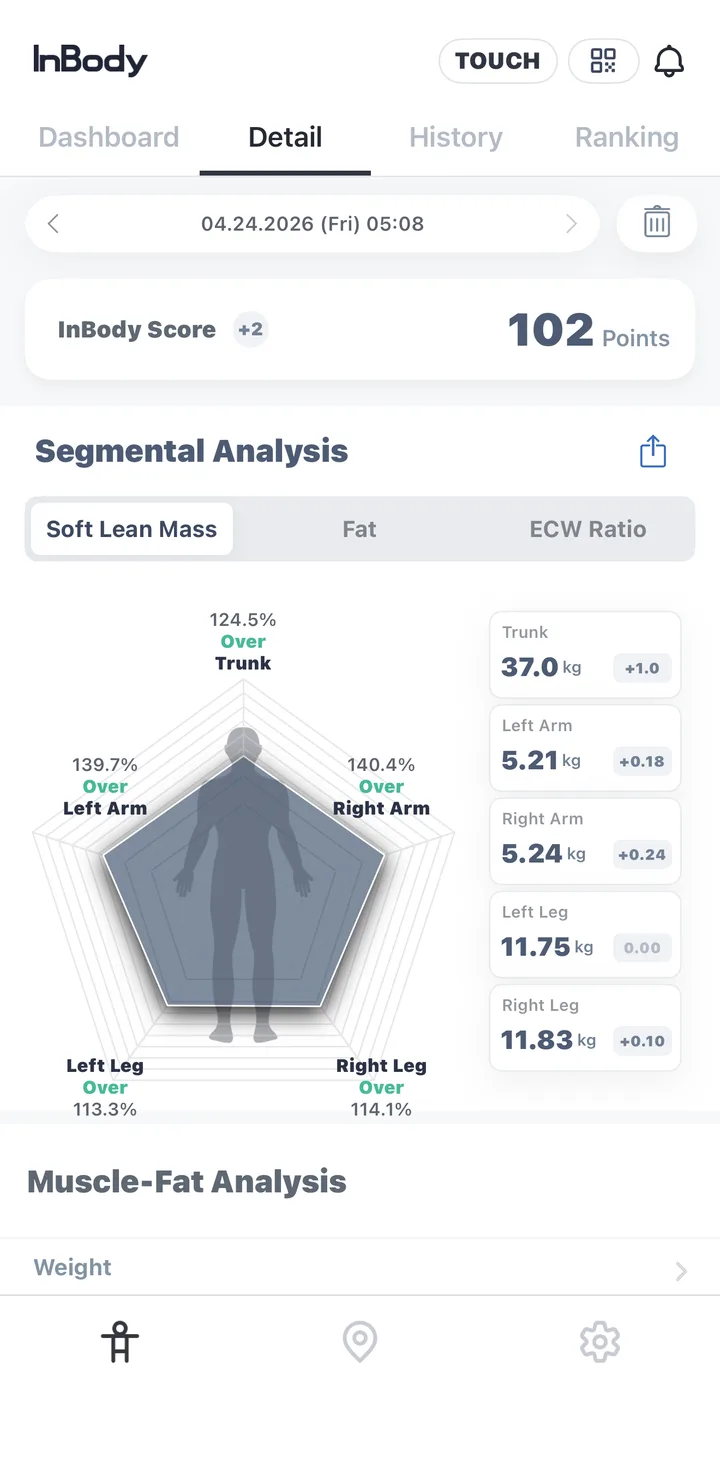
Segment-by-segment balance
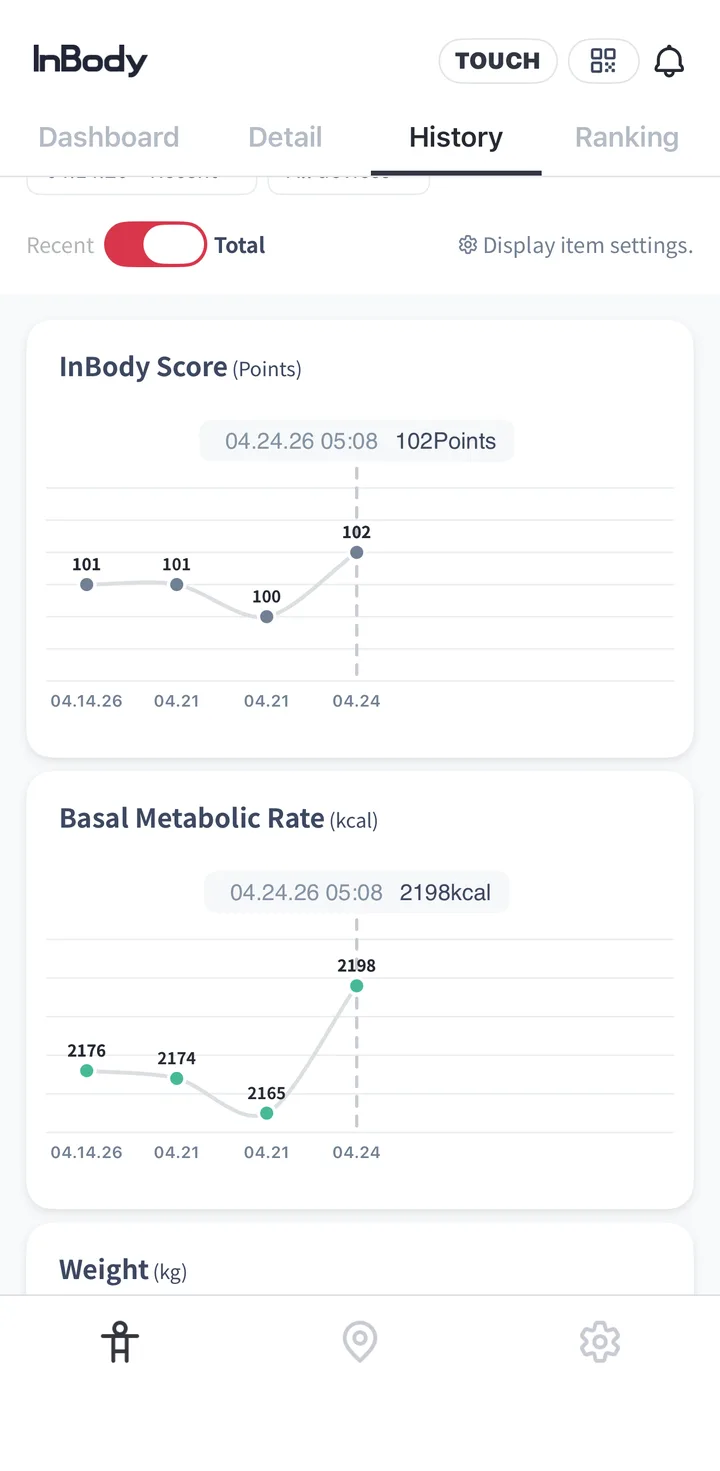
Your history across scans
Screens from a real BodyIntel scan, shared with permission. Personal details redacted.
- Right arm5.24 kg
- Left arm5.21 kg
- Trunk37.0 kg
- Right leg11.83 kg
- Left leg11.75 kg
Real values from a single BodyIntel scan, shared with permission. Not a medical assessment.
What each number in your report means.
Skeletal muscle mass (SMM), kg
The total weight of the muscle attached to your skeleton: the muscle you use for movement, strength and athletic performance. Your report shows total SMM in kilograms plus a segmental breakdown across your arms, legs and trunk.
Why it matters for training: tracking SMM over time shows whether your training is building lean mass. It is one of the clearest body composition markers of strength training progress, more useful than weight alone, which can change for many reasons.
Body fat percentage and mass, % and kg
Your fat mass as a proportion of total body weight, shown as both a percentage and raw kilograms, compared against benchmark ranges for your age and gender group so you have context around the number.
Tracking over time: on repeat scans you see your previous result alongside your current one, making body composition change easy to see in response to training or nutrition adjustments.
Phase Angle, body composition benchmark
Derived from the relationship between resistance and reactance in the bioelectrical impedance signal, Phase Angle reflects the integrity of the cell membrane, which is influenced by muscle mass and cellular hydration. A higher Phase Angle is generally associated with greater muscle mass and better cellular hydration, and it is also studied in clinical research as an indicator of cellular health and nutritional status. Track it over multiple scans, compare it against your age and gender group benchmarks, and share it with your coach or health professional.
Total body water (TBW), litres
Your intracellular and extracellular water balance, one of the key components of body composition measured by the InBody 970 and a useful marker of hydration status over time.
Basal metabolic rate (BMR), kcal
An estimate of caloric expenditure at rest, derived from your lean muscle mass composition. Treat it as a starting point for conversations with your coach or dietitian, not a prescription.
Composition history
On repeat scans, your report shows your previous result alongside your current one. A series of scans every four to eight weeks shows whether your training and nutrition are actually changing your body composition.